The author lives in the Northwest corner of the US and is currently employed by King County Wastewater Treatment Division as GIS Specialist.
The content presented herein represents the opinion of the author and do not reflect those of the employer.
Chance to explore Mt Rainier for four days in the first week of August.
We planned to do the Northern Loop of Mt Rainier but couldn’t secure the backcountry permit, so we set up a base camp at White River Campground within Mt Rainier National Park and hiked each day. Dave, Chuck, Adam (sorry to miss you), and I had planned before COVID-19 and had to cancel it back in 2020. The weather was fabulous, the scenes were amazing, and the hiking was great, but mostly, just talking and sharing stories with/ friends were the best!
It’s day #5 of riding Four River Bike Trails. It’s October 8th, Sunday. After spending hot spring town, I made my way up the highest point of the trip.
And Finally, here is a Summary of my trip in two short videos, the trip was an amazing and wonderful trip to see old friends, meet new friends, and visit the country of my birth. I’m already planning a future trip with the folding bike (Brampton, for example) and exploring other listed Four River Trails in my head 🙂
The first few days were not easy to ride, only able to maintain about 12 to 13 mph due to the bike’s weight. A bike shop owner suggested that I should send the extra weight back to Seoul and took that message to heart. I was able to send the package about 12 lbs. I just went to a local convenient store (where I buy water, breakfast, lunch) and put extra stuff into a box and mailed to a friend’s house in Seoul.
Along the way I saw wastewater treatment plant and couldn’t resist to stop and taking some pictures of the “hidden infrastructure”. I’m was enjoying visible bike infrastructure but working in the “hidden infrasture” I appreciate the work they do.
It’s October 3rd, Wednesday. Due to a mechanical issue, I had to delay the start date by a day. I was fortunate to meet up with Tom from Seattle, who started his ride with his sister the next day. I left around noon and realized that my total bike weight was a little more than I remembered from Seattle, oops. Anyway, got lost getting out of Seoul (due to so many bike trails, a good problem to have).
Day #1 of Ride – Daily Trip Report – Rode through a downpour for about an hour and a half but thanks to rain gear stayed dry. Met another Korean rider who was traveling with his Brompton and rode together to the lodge. Flat trail with very little hill climb.
Day #2 of Ride – Daily Trip Report: The Weather was fantastic and the trail was just wonderful with no one else riding. I was 99% on the dedicated flat bike trail with awesome views. I was traveling through a converted old train track with a great many tunnels. I had a great lunch along the way. I’m now on South Han River bike trail.
The previous day (Saturday 9/30), I did a short tour of the restored neighborhood. The area has been featured in many commercial advertisements and many K-drama settings. Lots of old traditional wooded houses Han-oak (한옥), very beautiful. I’ve posted my bike (made out of hickory wood) in front of it.
And being a GIS guy (making maps for a living), I couldn’t pass an awesome-looking old map! The map shows the layout of the central area of Seoul, many things have changed after Japan colonized Korea (1910 – 1945). The brown circle area is the neighborhood I’m staying (Insa-dong). I also took pictures of a great design of Seoul’s maintenance hole. Very cool!
I was ready to start my trip starting Monday, (next day). An Old family friend will hold my bike bag and carry-on luggage during my travel. So I was trying to install to attach my bike rack..AND.. I somehow misplaced tiny four screws after assembling my bike on Sunday, oops. The next day (Monday is still Chuesok, a Full moon harvest holiday) I wasn’t sure if I could find them at a local bike store that’s still open (I’ve gotten pretty good at looking for things in Korea using their Navar/Kakao maps! Most Koreans here don’t use Apple or Google Map.
I felt disappointment and panic simultaneously, but that’s how traveling sometimes goes. I was lucky enough to extend for one more night, and it’s always fully occupied. Then found a bike shop that carried those screws when I got there. Plus, this restaurant people were waiting so I decided to get lunch there and met a couple who waited for two hours for this place and told them about the bike trip and fiasco I created for myself. They told me that because of those screws, I could come here and meet them for lunch!! That was very nice of them. Also there were high school students waiting for repair at the bike shop and got talking to them. They were all riding fixies and some were riding 40km a week! I had so much fun talking to them!
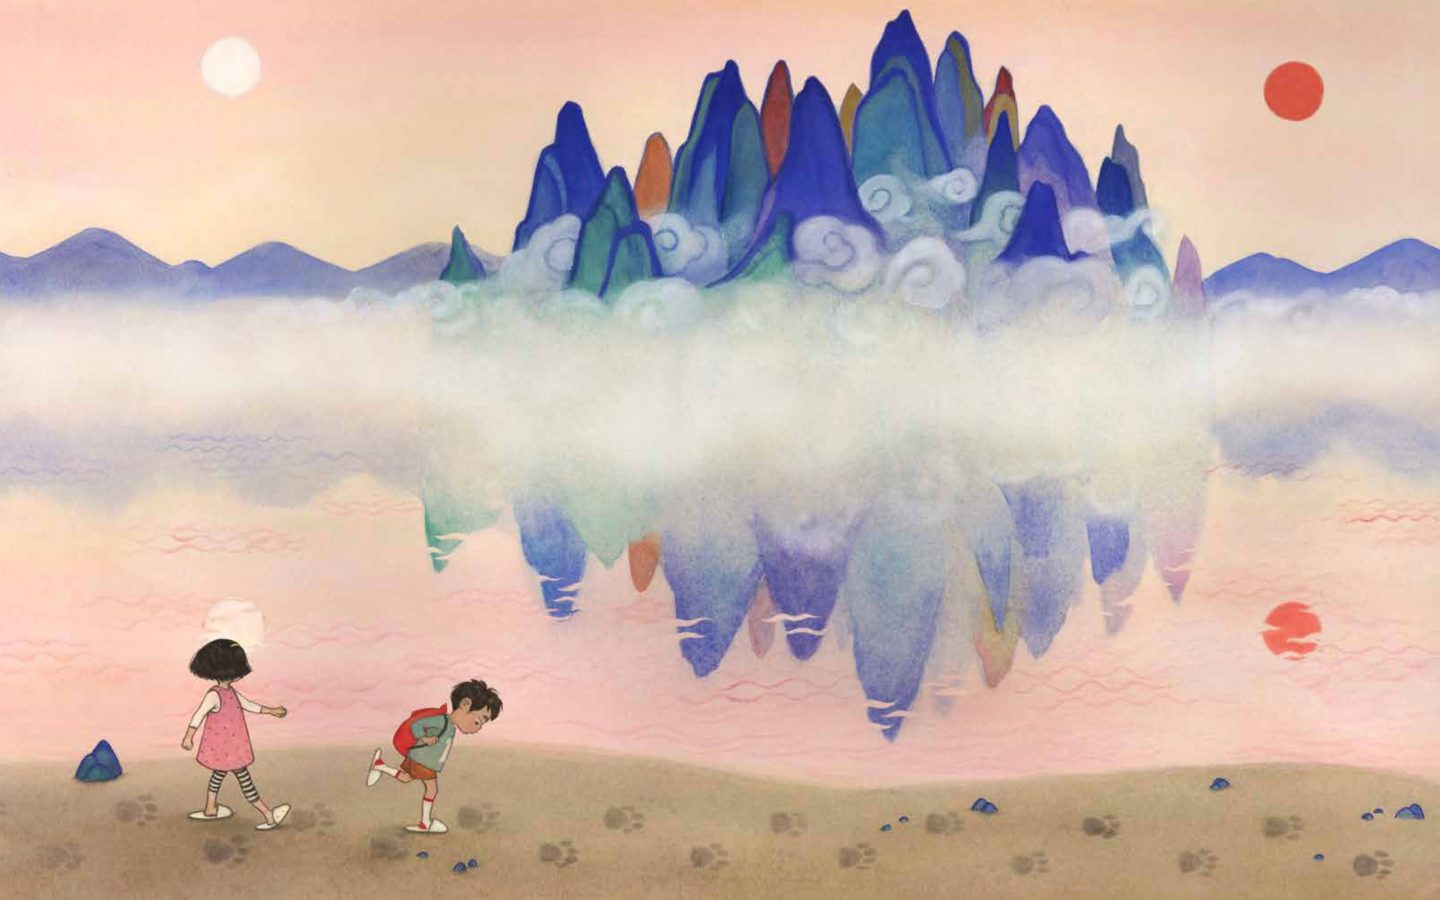
I visited an art installation about an urban city in the morning and then went to the Children’s book illustrator exhibit at Seoul Art Center then off to COEX mall (a famous large convention center).
Leaving Narita, Japan, to Seoul, Korea. It was about 2.5 hrs of flight and was a Korean Airline flying a Boeing 777 with almost full capacity, and the crew served a hot meal with drinks during the flight (not sure how they could serve so quickly and finished cleaning it up) . The last time I flew to DC for a 5.5-hour flight, I received a bag of crackers and a cup of soda 🙂
My first full day was in Japan. I traveled from Narita to Tokyo taking the local train. The train ride was about 1.5 hours long. I arrived at Tokyo Station, and its adventure was listed below. The station was incredibly large, and easy to get lost. I had to transfer but somehow I exited the terminal and had to purchase a second ticket to get back into the station at Chiba station on my way to Tokyo, oops.